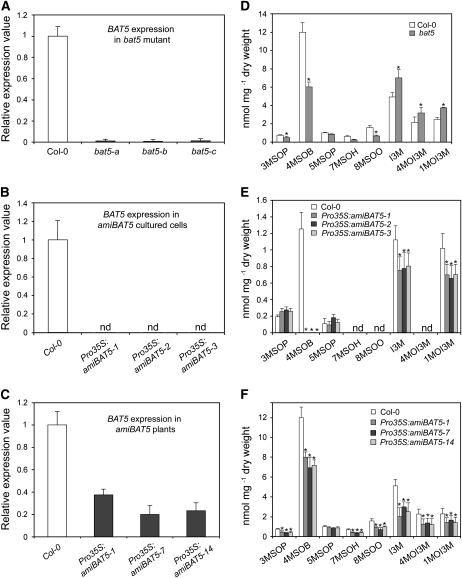
Figure 5.
Analyses of the bat5 Mutant, Cultured Pro35S:amiBAT5 Arabidopsis Cells, and Stably Transformed Pro35S:amiBAT5 Plants.
(A) to (C) Steady state level of BAT5 mRNA in three different plants of the bat5 mutant (A), cultured Pro35S:amiBAT5 Arabidopsis cells (B), and stably transformed Pro35S:amiBAT5 plants (C). Relative gene expression values are given in comparison with the wild-type (Col-0) plants or wild-type cells (wild type = 1). Means ± sd (n = 3). nd, not detectable.
(D) Contents of GSs (nmol/mg dry weight) in bat5 mutant plants in comparison with the wild type (Col-0). Means ± sd (n = 5).
(E) Contents of GSs (nmol/mg dry weight) in Pro35S:amiBAT5 cultured Arabidopsis cell lines in comparison with wild-type cells. The levels of long-chained aliphatic GSs were below the detection limit in both wild-type cells extracts and in Pro35S:amiBAT5 cells. Means ± sd (n = 3).
(F) Contents of GSs (nmol/mg dry weight) in Pro35S:amiBAT5 stably transformed Arabidopsis plants in comparison with cultured wild-type cells. Means ± sd (n = 5). Asterisk indicates significant difference in comparison to the wild-type Col-0 (Student's t test, P < 0.05).

