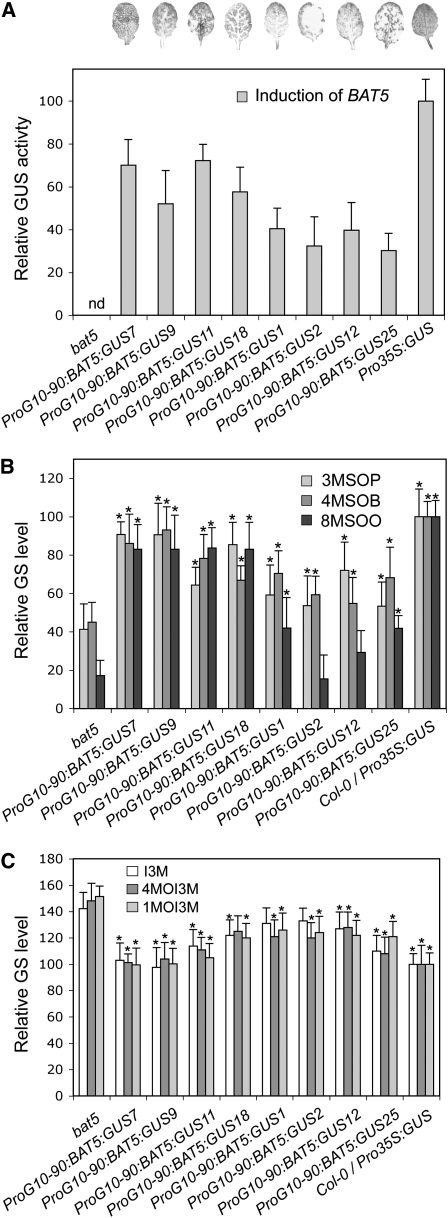
Figure 7.
Gene Complementation Analysis of bat5 Mutant Plants Using an Inducible Promoter BAT5 Construct Fused to the GUS Gene.
Relative GUS activity values (A) and levels of aliphatic (B) and indolic (C) GSs after induction with β-estradiol are shown. Wild-type levels were set to 100%. Asterisk indicates significant difference (Student's t test, P < 0.05) in complemented lines compared with the bat5 mutant.

