Figure 3.
Specificity Determinants for Recognition of AvrPtoB by Pto.
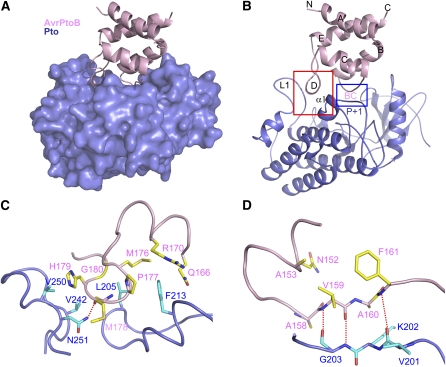
(A) Overall structure of the complex between AvrPtoB121-205 and Pto. AvrPtoB121-205 and Pto are colored in pink and slate, respectively. Pto is shown as a surface representation.
(B) Illustration of the overall structure of the complex between AvrPtoB121-201 and Pto with the same orientation as in (A). The red frame highlights interface 1, and the blue frame highlights interface 2 of the complex. BC represents the loop linking helices B and C in AvrPtoB.
(C) The detailed interactions around interface 1 highlighted in the red frame shown in (B). The side chains of AvrPtoB and Pto are shown in yellow (labeled in pink) and cyan (labeled in dark slate), respectively. Relevant amino acid residues are numbered, and a hydrogen bond is shown as a red dashed line.
(D) The detailed interactions around interface 2 highlighted in the blue frame shown in (B). The side chains of AvrPtoB and Pto are shown in yellow and cyan, respectively. Relevant amino acid residues are numbered, and hydrogen bonds are shown as red dashed lines.

