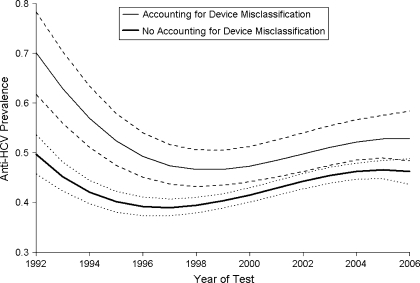
Figure 1.
Estimated hepatitis C virus (HCV) antibody prevalence trend for injecting drug users before and after accounting for test device sensitivities and specificities, England and Wales, 1992–2006. All other covariates are set to their mean values. Dashed lines show 95% credible intervals for the model accounting for device misclassification. Dotted lines show 95% credible intervals for the model not accounting for device misclassification.

