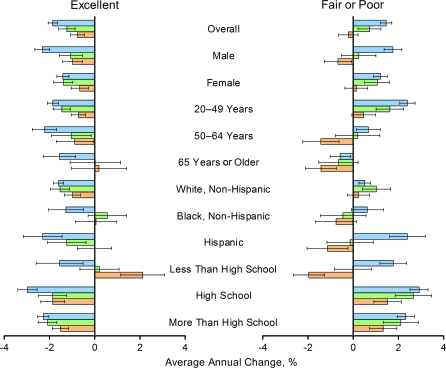
Figure 5.
Average annual change in the odds of reporting “excellent” or “fair/poor” self-rated health, by sex, age, race/ethnicity, and education, United States, 1998–2007. Each bar shows the result of a separate logistic regression of self-rated health as a function of calendar year, estimated for a particular survey and population subgroup. Blue, Behavioral Risk Factor Surveillance System; green, National Health Interview Survey; orange, Current Population Survey.

