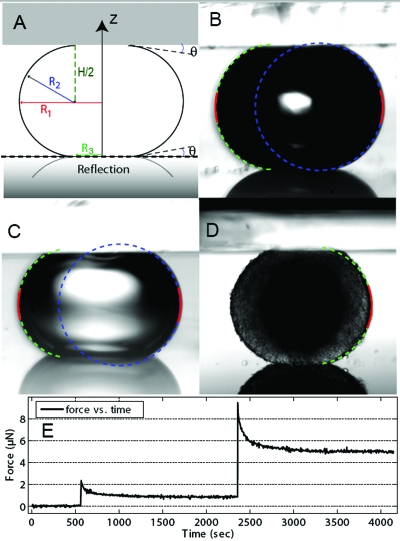
Figure 1. (A) Diagram of a liquid droplet compressed between two parallel plates with a contact angle θ.
At equilibrium, R1 and R2 are the two primary radii of curvature, at the droplet’s equator and in a plane through its axis of symmetry, respectively. R3 is the radius of the droplet’s circular area of contact with either compression plate. H is the distance between upper and lower compression plates. The reflected profile on the bottom plate visible in (B)–(D) is also represented on this diagram. (B)–(D) Snapshots of compressed droplets: (B) air bubble (R1=282 μm) in culture medium, (C) water droplet (R1=207 μm) in mineral oil, and (D) mouse embryonic cell aggregate (R1=297 μm) in culture medium. Red curves correspond to the calculated profile with a second order polynomial fit (LPF method), dotted lines correspond to the calculated profiles with the exact Laplace profile method (ELP, green) and the circular arc approximation (blue). The latter is not represented in order to appreciate the embryonic aggregate roughness in (D). (E) Force signal as measured by our cantilever and an eddy current position sensor: the peaks of force just after a compression are followed by a force relaxation period of about 10 min. We measured the force and shape parameters for the surface tension evaluation at least 30 min after the compression step.

