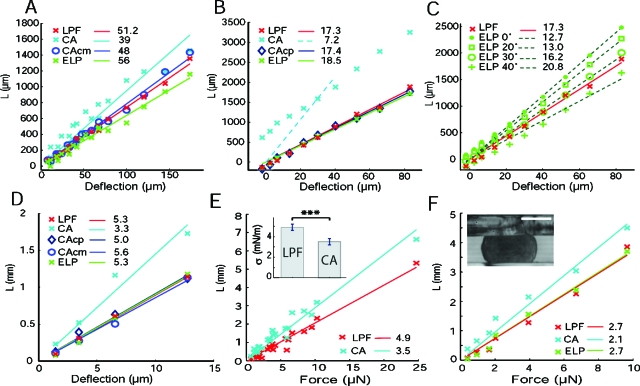
Figure 2. Plots of the geometrical parameters.
P, LMandLEas a function of cantilever deflectionδ(A–D) or force F (E,F). Surface tension values (displayed in the legend in mN∕m) are obtained by taking the slope of the obtained linear fits, with LP, LM, and LE obtained as defined in Eqs. 1, 3, 5, and δ=F∕k (with k∼0.36 N∕m for all experiments). Air bubble in CO2 independent culture medium at 37 °C (A), water droplet in mineral oil at room temperature (B,C), F9 embryonic cell aggregate in CO2 independent culture medium at 37 °C (D,E), and chicken embryonic neural retina aggregate in CO2 independent culture medium at 37 °C (F). In the inset of (E), we show that the difference between the mean measured values with each method is statistically significant. In the inset of (F), we show a snapshot of compressed neural aggregate (bar, 200 μm). Abbreviations of the different methods tested are as follows: ELP, exact Laplace profile; LPF, local polynomial fit; CA: circular arc; CAcm, circular arc with force calculated at median plane; CAcp, circular arc with force calculated on plates.

