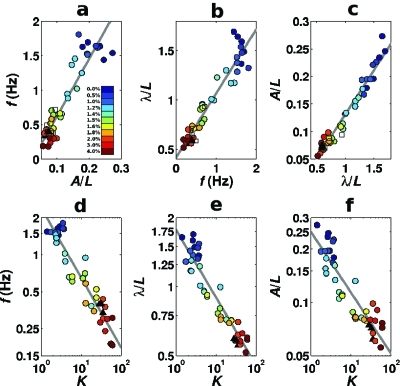
Figure 1. (a)–(c) Proportionality of key locomotion parameters in a variety of environments (a range of gelatin concentrations, deformable agar surface, non-deformable membrane surface, with n ⩾3 replicates per environment).
Lines show the best linear fits to the data. (d)–(f) frequency, wavelength, and amplitude of the locomotion wave all decay smoothly with K in the different media (gelatin and agar, with n⩾3 replicates per environment). Lines show the best power-law fits to the data. Note the doubly logarithmic scales. In all graphs, filled circles show gelatin data. Different colors represent different gelatin concentrations. Agar and membrane data are represented by black triangles and white squares respectively.

