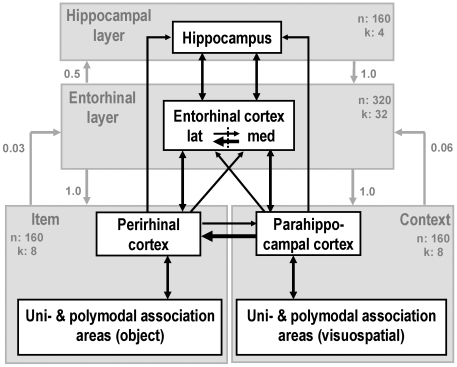
Figure 1. Diagram of the model used in the simulations.
The white box model represents the simplified anatomy of the medial temporal lobe. The gray overlay depicts the four modules of the model. For each module, the number of nodes (n) and the global inhibition parameter (k) are shown. Model connections are depicted by arrows, with connection density (as a proportion of full connectivity) listed besides each connection.

