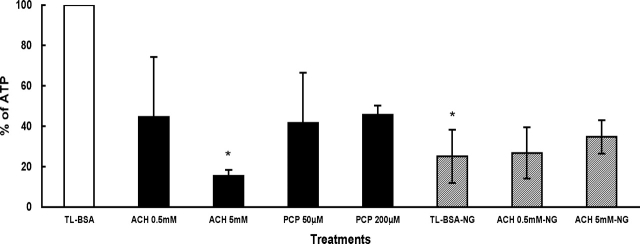
FIG. 4.
Intracellular ATP level after 1 h of treatment. The level of ATP is presented as percentage, and the TL-BSA with glucose is presented as 100% (open bar). The other treatments with glucose-containing media are shown in closed bars. Sperm treated in media without glucose (NG) are shown in patterned bars. Data are from three males and presented as % ± SEM. *, P < 0.05 when comparing mean differences with the TL-BSA control group.

