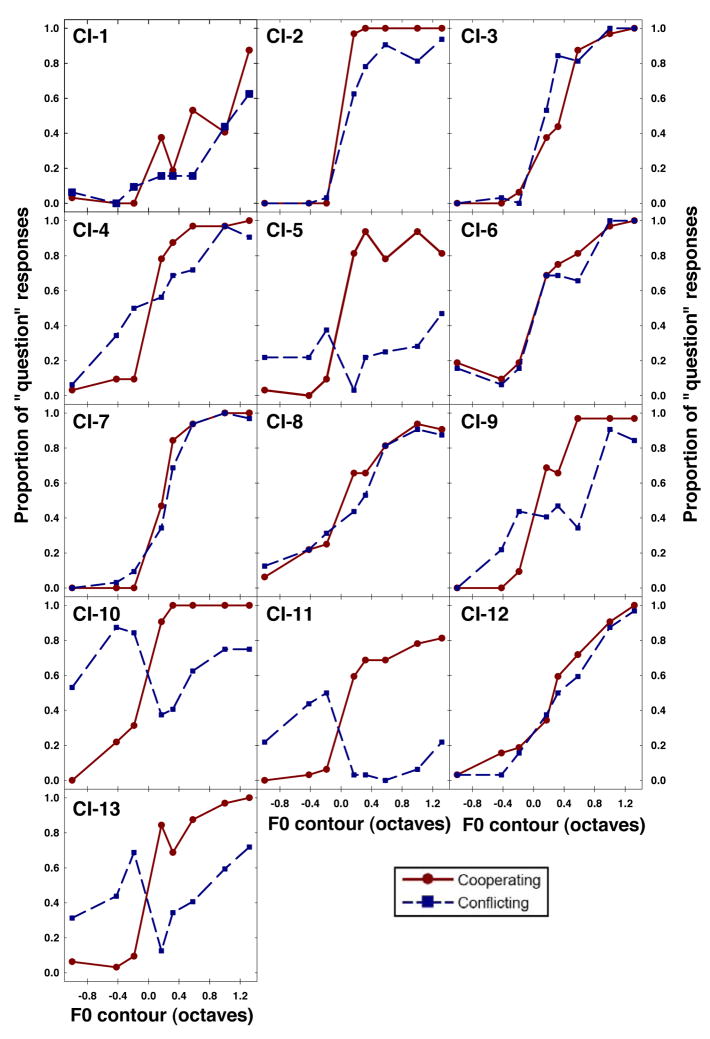
Figure 4.
Mean proportions of question judgments as a function of the F0 increments in the cooperating vs. conflicting conditions for individual CI listeners. Each panel displays the data obtained from each CI listener. In each panel, the x-axis indicates the steps of F0 contour increments; the y-axis indicates the proportions of question judgments. Data points in the cooperating and conflicting conditions are linked with solid and dashed lines, respectively.

