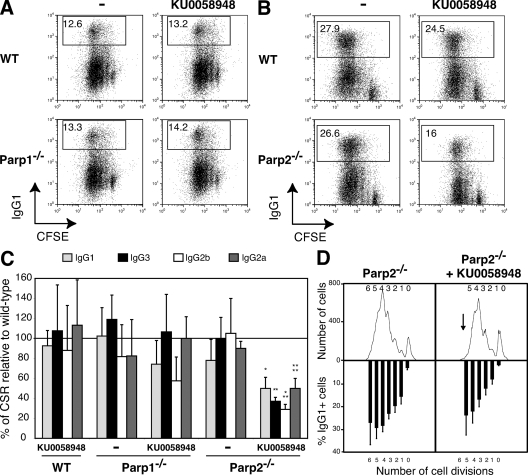
Figure 3.
Parp1 and Parp2 are not required for CSR in splenic B cells. Wild-type (WT), Parp1−/−, and Parp2−/− resting splenic B cells were stained with CFSE and cultured for 3 d with LPS (CSR to IgG3 and IgG2b); LPS + IL-4 (CSR to IgG1); LPS + IFN-γ (CSR to IgG2a); and in the presence or absence of 100 nM KU0058948 Parp inhibitor. Ig surface expression was determined by flow cytometry within the live cell population (gated using ToPro-3 exclusion) and using isotype-specific antibodies in at least five independent experiments. Cell division was measured by CFSE dye dilution. (A) IgG1 cell surface expression of WT and Parp1−/− B cells stimulated with LPS + IL-4 in the presence or absence of 100 nM KU0058948. The percentage of switched cells is indicated in each plot. (B) IgG1 cell surface expression of WT and Parp2−/− B cells stimulated with LPS + IL-4 in the presence or absence of 100 nM KU0058948. The percentage of switched cells is indicated in each plot. (C) The mean percentages (± standard deviation) of CSR relative to WT for the different isotypes tested are shown (IgG1, light gray bars; IgG3, black bars; IgG2b, white bars; IgG2a, dark gray bars). CSR in WT B cells was set to 100% (horizontal line). Statistical significance as determined by an unpaired Student's t test is indicated as follows: *, P = 0.0073; **, P = 0.0008; ***, P < 0.0001; ****, P = 0.0004. (D) Flow cytometric analysis of IgG1 expression on CFSE-labeled Parp2−/− B cells stimulated with LPS plus IL-4 for 3 d in the presence or absence of 100 nM KU0058948 Parp inhibitor. Cell division as measured by CFSE dye dilution is shown at top. The mean percentages (± standard deviation) of cells expressing IgG1 after a specific number of cell divisions is indicated on the bottom.

