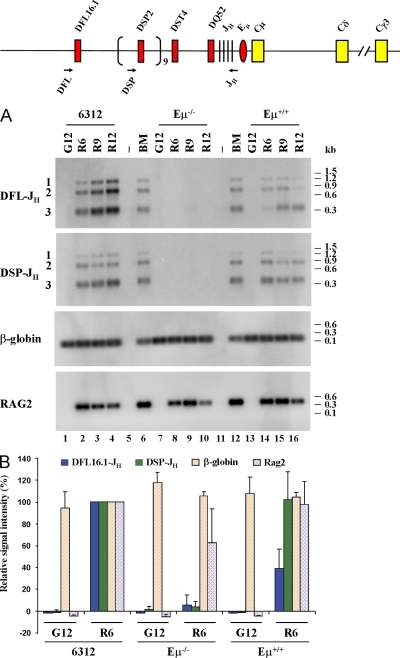
Figure 4.
Analysis of DH to JH recombination in Eμ− cells. (A) Abelson virus–transformed Eμ+RAG2− cell lines (6312, lanes 1–4; Eμ+, lanes 13–16) and an Eμ−RAG2− cell line (lanes 7–10) were infected with control (G) or RAG2-expressing (R) retroviruses. Genomic DNA prepared after 6, 9, and 12 d was used to analyze DFL16.1 and DSP2 rearrangements as described in Materials and methods. Location of DH-specific 5′ primers and the common 3′ primer are shown as arrows on the top line. The infection efficiency of the RAG2 virus was 10–15% in 6312 cells as determined by GFP fluorescence. This number could not be determined for Eμ+ or Eμ− cells because all cells were GFP+ before infection. The level of introduced RAG2 in each cell line was determined by PCR amplification of genomic DNA (labeled RAG2). Reactions in lanes 6 and 12 were performed with genomic DNA from total bone marrow cells from a C57BL/6 mouse, and those in lanes 5 and 11 were performed with water to serve as positive and negative control, respectively. An amplicon from the β-globin gene was used to ensure equal DNA usage from all samples. After PCR amplification, the products were fractionated by agarose gel electrophoresis and the products assayed by Southern blotting. Data shown is representative of three independent infection experiments. (B) Signals from control retrovirus-infected day-12 (G12) samples and RAG2 retrovirus-infected day-6 (R6) samples from 6312, Eμ−RAG2−, and Eμ+RAG2− cell lines were quantitated by phosphorimager. Signal intensities from 6312 cells (6312 R6) were taken as 100% and compared with all other samples. Data shown is the mean of three independent infection of each cell line, analyzed in duplicate by PCR and Southern blotting. Error bars represent the standard deviation between experiments.

