Figure 5.
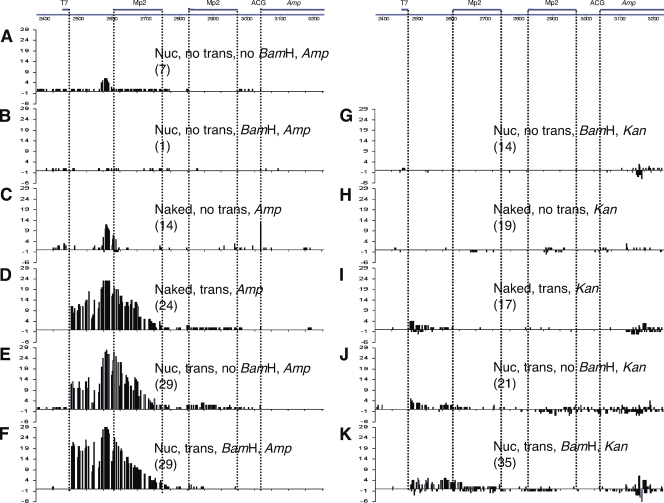
Mutation patterns in pKMP2 treated with AID. Cytosine deaminations in the vicinity of the Ampr gene. The sequenced region is shown at the top. Numbers in parentheses are the numbers of sequenced plasmids isolated from E. coli colonies that had any mutation. The E. coli were grown in ampicillin (A–F) or kanamycin (G–K). The treatments of pKMP2 before E. coli transformation are indicated by the following: Nuc, nucleosomal DNA; trans, transcription; no trans, no transcription; BamHI, digestion with BamHI; no BamHI, no digestion with BamHI; naked, supercoiled DNA not incubated with histone octamers. Mutations on the top of the line are from the top (nontranscribed) strand; mutations on the bottom are from the bottom (transcribed strand). ACG, codon that is expected to be changed by AID to the initiation codon ATG. To obtain statistics, we tested the null hypothesis that the proportion of clones with mutations in the MP2 sequences in different conditions are equal, using a Fisher’s exact test for numbers of clones with mutations in MP2 over total mutated clones in the same condition. 5C→5A, P = 0.016 (thus, 5C has significantly more MP2 mutations than 5A); 5H→5G, P = 0.027 (thus, 5H has significantly more MP2 mutations than 5G); 5K→5G, P = 0.021 (thus, 5K has significantly more MP2 mutations than 5G). The “spurious” clone 5B (see text) has the same proportion of MP2 mutations as 5H (P = 1.0). The numbers on the y axis indicate the numbers of sequences that had a mutation at the indicated position. The sequences of plasmids with mutations are shown in Figs. 6, 8, 9, and S1–S8. The experiments shown in Fig. 5 were repeated four times (B–E and G–K), three times (F), and two times (A) with similar results.

