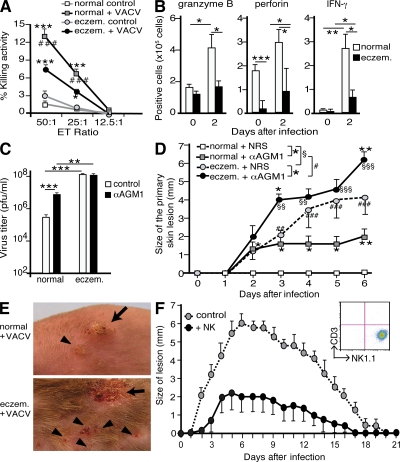
Figure 3.
Reduced NK cell activity was critical for the development of VACV-induced erosive skin lesions in eczematous mice. (A) NK cell cytotoxic activity of splenocytes on day 2 after infection was measured using YAC-1 cells as target cells at the indicated effector-to-target ratios. Shown are results representative of 5 independent experiments. Data represent means and SEM values. *, P < 0.05; and ***, P < 0.001 versus uninfected mice. ###, P < 0.001 versus eczematous mice. (B) Flow cytometric analysis of CD3− NK1.1+ NK cells expressing granzyme B, perforin, or IFN-γ in spleens. Shown are results representative of 8 independent experiments. *, P < 0.05; **, P < 0.01; and ***, P < 0.001. (C) Virus titers in spleens from αAGM1- or NRS-treated mice. (D) Sizes of primary skin lesions in αAGM1- or NRS-treated mice. *, comparison between αAGM1- and NRS-treated mice; #, comparison between αAGM1-treated normal and eczematous mice; and §, comparison between NRS-treated normal and eczematous mice (one, two, and three symbols indicate P < 0.05, 0.01, and 0.001, respectively. (E) Virus infection in αAGM1-treated normal mice induced erythematous papules at the inoculation site (indicated by the arrow; top) and satellite lesions. Satellite lesions were also induced in αAGM1-treated eczematous mice (indicated by arrowheads). Satellite lesions in both normal/αAGM1 and eczematous/αAGM1 mice were confirmed to contain live virus. Shown in C–E are representative results of three independent experiments (n = 4–8 mice per group). (F) Adoptive transfer of cultured NK cells. Sizes of primary skin lesions are shown. The inset shows the purity of transferred NK cells as analyzed by flow cytometry. Shown are results representative of three independent experiments. Data in A and C–F represent means and SEM values; data in B represent means and SD values.

