Figure 3.
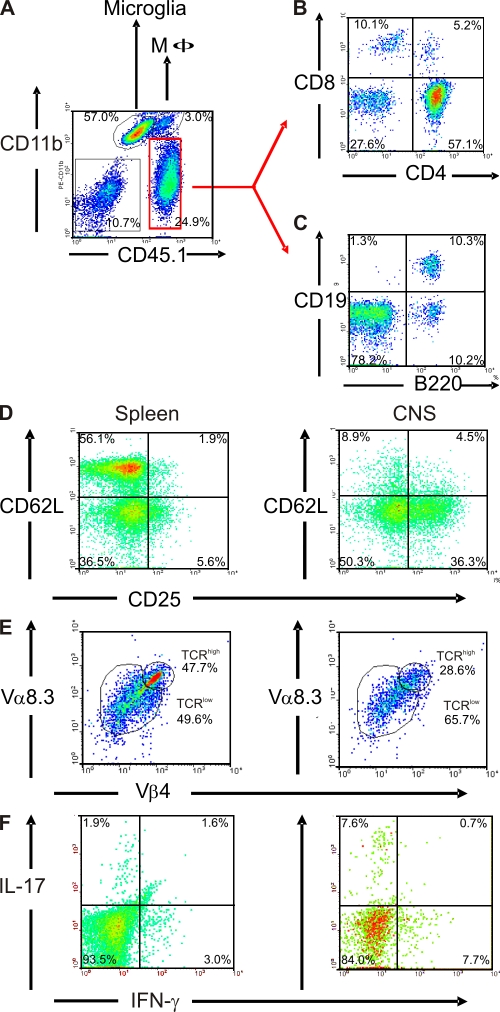
Inflammatory cell infiltrates in RR-EAE lesions. (A–C) Cellular infiltrate into the CNS of sick TCR1640 mice (score 3) is composed of macrophages, T cells, and B cells. CNS mononuclear cells were isolated from a sick TCR1640 mouse and stained against CD11b and CD45.1 (A), together with CD8 and CD4 (B) or together with CD19 and B220 (C). Cells in B and C were analyzed among gated CD45.1+CD11b− cells (red region as indicated). (D–F) Activation and Th1/Th17 cytokine expression of infiltrating CD4+ T cells. (D) CNS infiltrate cells express CD25, but not CD62L, and partially down-modulate their TCR (Vα8.3 and Vβ4). Activation status and TCR expression was compared between splenocytes (left) and CNS-isolated cells (right). (E) CD4+CD3+ T cells infiltrating the CNS of sick TCR1640 mice predominantly expressed the pathogenic TCR composed of Vα8.3 and Vβ4 chains in a low expression level (TCRlow) compared with the spleen. Numbers indicate the percentage of stained cells in the respective quadrant or region. (F) Intracellular cytokine staining after stimulation with PMA/ionomycin in brefeldin A. Th1 (IFN-γ+/IL-17−) and Th17 (IFN-γ−/IL-17+) cells are enriched in CNS infiltrates of sick TCR1640 (score 3.5) mice compared with splenocytes. D–F were analyzed among gated CD45.1+CD4+ cells. Flow cytometry data are representative of three to five sick TCR1640 mice analyzed in three to five independent experiments.

