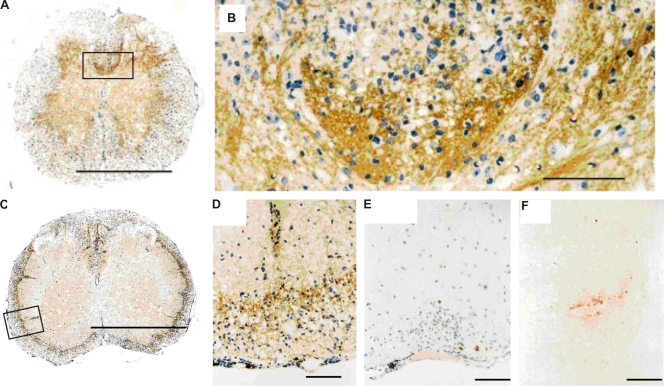
Figure 4.
Ig deposition and B cell infiltrates in spinal cord of sick TCR1640 × IgHMOG and TCR1640 mice. (A–D) Histological analysis of spinal cord using anti-Ig antibodies shows deposition of Ig in sick TCR1640 × IgHMOG (A and B) and TCR1640 (C and D) mice (B and D show magnifications of marked areas in A and C, respectively). (E) Anti-B220 staining revealed some B cells among cellular infiltrates in sick TCR1640 mice. (F) Deposition of complement C9neo within CNS lesions of TCR1640 mice. Mononuclear cells were stained with H&E. Magnifications: A and C, ×50; B, ×425; D and E, ×200; F, ×450. Bars: (A and C) 1 mm; (B and D–F) 100 µm. Data are representative of at least two independent experiments consisting of more than three mice per group.

