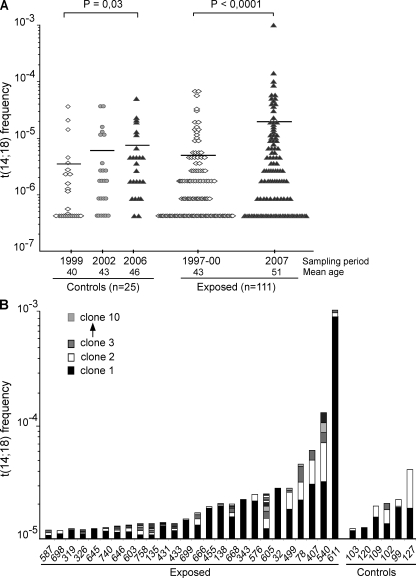
Figure 1.
Agricultural exposure drives a dramatic increase of t(14;18)+ clones in blood. (A) Evolution of t(14;18) frequency in PBMCs from control and exposed populations over time. The mean age at enrollment was 40 yr (±9 yr) for the controls and 43 yr (±9 yr) for the exposed individuals, with an average follow-up time of 7 and 9 yr, respectively. t(14;18) frequency was assessed at each time point by fluctuation SR-PCR. Horizontal lines indicate mean frequencies. p-values were calculated using the Mann-Whitney test. (B) Clonality analysis. Exposed (n = 26/51, 51%) and control (n = 6/46, 13%) samples with a high t(14;18) frequency (>10−5) in the last sampling period are shown and ordered according to increasing t(14;18) frequencies (the total number of clones in each individual for which more than one positive amplicon was found is summarized in Table S1). BCL2/JH breakpoints (Table I and unpublished data) were identified by the cloning/sequencing of SR-PCR products (n ≈ 1,000) amplified from PBMCs, and were used to monitor the extent of polyclonality within t(14;18)+ cells in each individual. For each individual, independent BCL2/JH clones are pictured in distinct shades and are represented from bottom to top according to increasing frequency.

