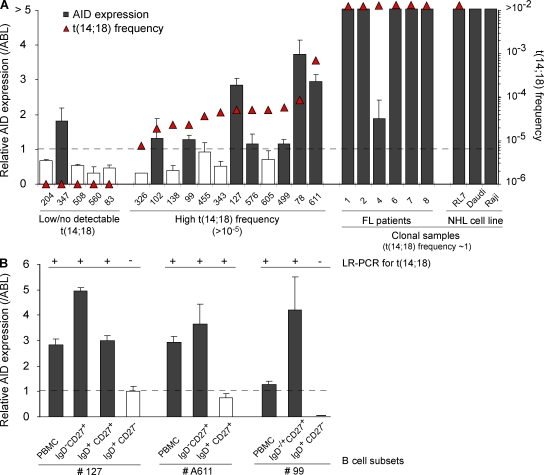
Figure 3.
AID expression correlates with increasing t(14;18) frequencies in HI. (A) Superposition of t(14;18) frequency (triangles; left y axis) and the relative AID expression levels (histograms; right y axis) in PBMC samples from HI (n = 18), FL patient samples (n = 6), and lymphoma cell lines (RL7, FL; Daudi and Raji, Burkitt lymphoma) evaluated by real-time quantitative PCR. The expression data were normalized to ABL. As AID expression is assumed to be low/negative in naive cells, RT-PCR data are represented relative to the levels obtained in the sorted naive (CD19+CD27−IgD+) B cell fraction and are considered positive (shaded histograms) above this arbitrary threshold of 1 (dashed line). The results shown were obtained from two independent PCRs performed in duplicate (except for clonal FL samples). (B) AID expression is enriched in t(14;18)+ fractions. Comparison of t(14;18) detection (+/−, as determined by LR-PCR) and AID expression levels (shaded histograms) in isolated B cell subsets (based on CD27 and IgD markers) from two HI. The results shown were obtained from one PCR performed in duplicate (except for PBMC samples analyzed two times in duplicate). Data were normalized as in Fig. 3 A.

