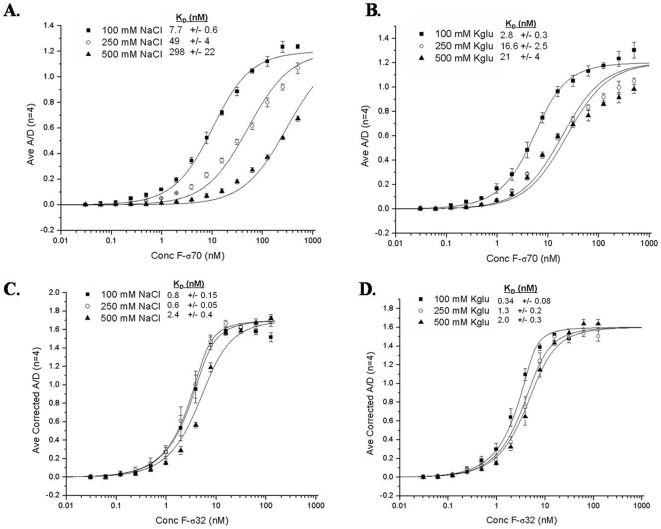
Figure 6. The salt dependence of the interaction of F-σ70 or F-σ32 with 10 nM Tb-core.
To determine the effect of NaCl and KGlu on the interaction strength, binding curves were generated for the interaction of either F-σ70 or F-σ32 with 10 nM Tb-core at 100 mM, 250 mM, or 500 mM NaCl or KGlu. Shown is the average acceptor/donor signal (A520/A490) for each sample. The error bars represent the standard deviation for a sample size of 4. The curves were fit with Origin 7 and the KD values are listed for each curve. A) The effect of NaCl on the interaction of F-σ70 with 10 nM Tb-core. B) The effect of KGlu on the interaction of F-σ70 with 10 nM Tb-core. C) The effect of NaCl on the interaction of F-σ32 with 10 nM Tb-core. D) The effect of KGlu on the interaction of F-σ32 with 10 nM Tb-core.

