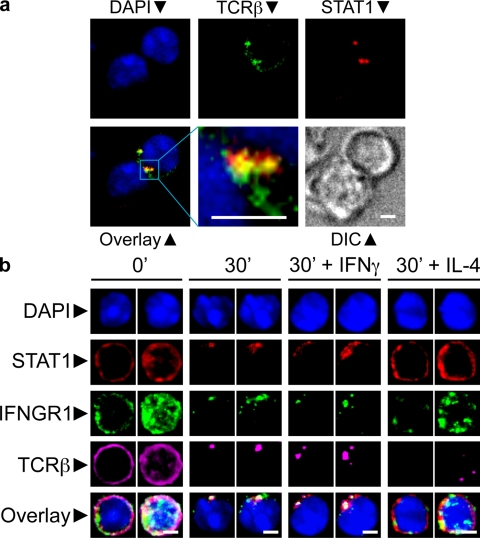
Figure 1.
Corecruitment of TCR, IFNGR1, and STAT1 to the IS. (a) Thps were purified from the LNs of young animals by magnetic negative separation using antibody-coupled microbeads and the MACS system, followed by FACS sorting of CD4+CD62highCD25-CD44low cells. These Thps from OTII transgenic mice were mixed with OVA peptide-pulsed DCs, fixed, stained, and imaged for the markers indicated. Shown are pictures of two independent experiments. (b) Sorted Thps were stained and activated by TCR cross-linking with a combination of anti-TCRβ (APC) and goat anti-hamster antibodies (Alexa-647). When indicated, 20ng/ml of recombinant mouse IFN-γ or IL-4 was added to the culture. Cells were fixed and stained with monoclonal antibodies directed against the indicated molecules. For every condition indicated, left images represent the middle optical z section of the cell, and the right image represents the maximum projection for all the z sections of that cell. Images in the figures were processed to exclude out-of-focus pixels with the nearest neighbors deconvolution method. Shown are pictures of four independent experiments. Bars, 3 µm.

