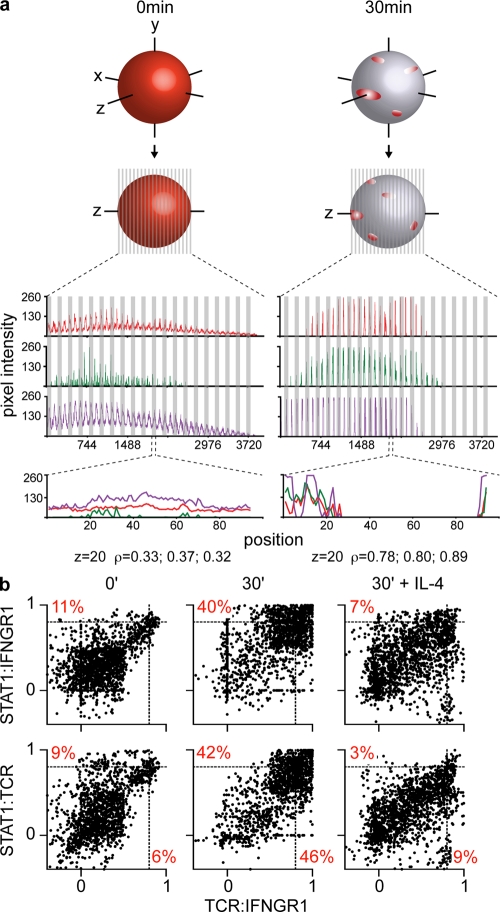
Figure 2.
Quantification of TCR, IFNGR1, and STAT1 corecruitment. (a) Linearization of the cell membrane. Schematic representation of the redistribution of membrane receptors on the surface of Thps before and after activation (top). Regions around the cell surface were drawn and scanned using the Metamorph software to obtain the mean pixel intensities of the membrane-bound markers analyzed with their x, y coordinates in all z planes of every cell. Top histograms depict the totality of z sections of one cell where pixel intensities (y axis) were plotted according to their position in a concatenated fashion, with one z section per every 40–100 positions in the x axis. Bottom histograms represent the middle z section of the cell (z = 20) where pixel intensities were plotted according to their position in the region (x axis, 100 positions scanned). STAT1, red; IFNGR1, green; and TCR, purple. (b) Corecruitment analysis by whole cell linearization of the cell surface and correlation plots. In these correlation plots where every dot represents the value of correlation between the distributions of STAT1 and IFNGR1 (left) or STAT1 and TCR (right) in the y axis and TCR and IFNGR1 on the x axis in one z section of a particular cell. This analysis results from combination of four independent experiments.

