Figure 2.
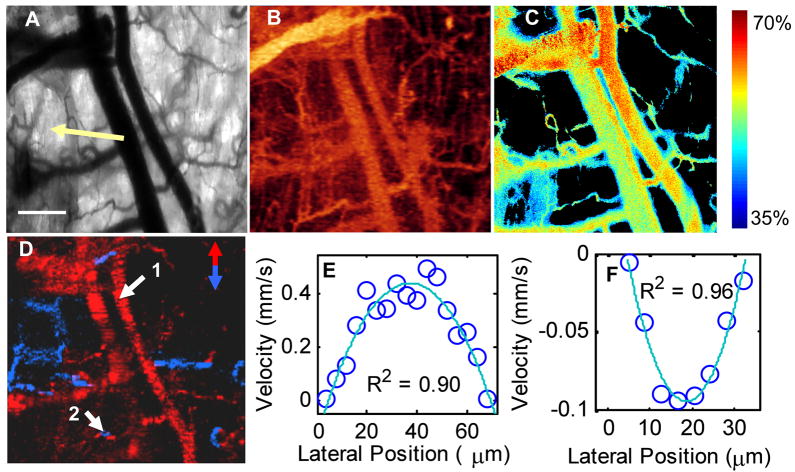
Multidimensional functional imaging of 4T1 tumor vasculature in the dorsal skin fold mouse window chamber. Transmission image of the window chamber taken with the liquid crystal tunable filter set at 500 nm, with a portion of the tumor visible (arrow, a). Scale bar is 200μm. Speckle variance OCT image of vessel morphology shown as an en face average intensity projection over 1 mm depth (b). Hyperspectral image of percent hemoglobin oxygen saturation (c), thresholded for the R-squared value of the linear fit and total absorption value at each pixel (background pixels are black). Doppler OCT image of vessel blood flow direction shown as an en face maximum intensity projection over depth (d), with red vessels flowing toward the top of the image, and blue vessels flowing toward the bottom of the image. The flow profiles at point 1 (e) and point 2 (f) were fit to a second order polynomial and corrected for the angle of incidence to provide velocity in mm/s.

