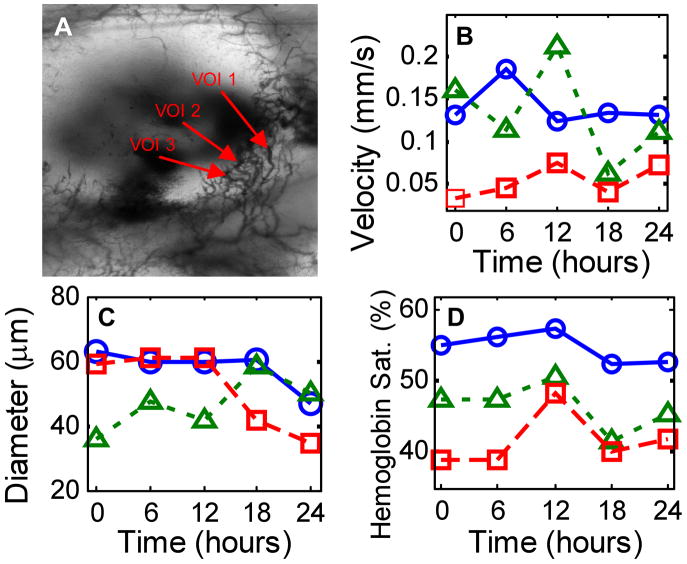
Figure 3.
Time series data taken from a 4T1 window chamber tumor using the combined hyperspectral/OCT microscope. The transmission image (a) is 3 mm (height) by 2 mm (width) and delineates the three vessel cross-sections of interest (VOI) for which maximum blood velocity (b), diameter (c), and hemoglobin saturation (d) are plotted (○ VOI 1; Δ VOI 2; □ VOI 3).

