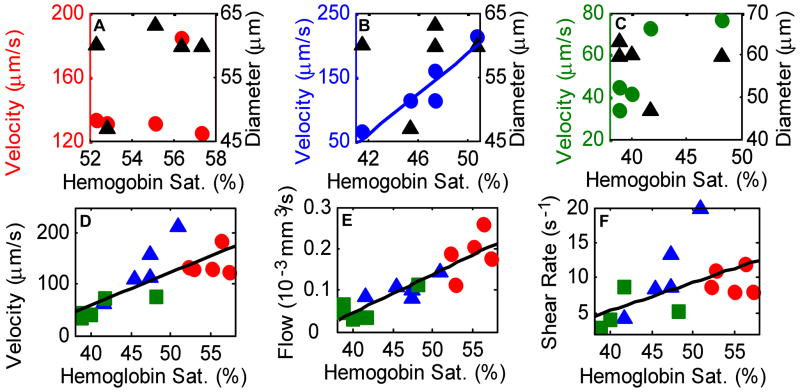
Figure 4.
Scatter plots of maximum velocity vs. hemoglobin saturation (○) and diameter vs. hemoglobin saturation (Δ) for VOI 1 (a), VOI 2 (b) and VOI 3 (c). There was a strong correlation (b) between the maximum velocity and hemoglobin saturation for VOI 2 (ρ = 0.94, p = 0.018, N = 5), and no correlation for any other VOI (p>0.05). However, when all VOI (○ VOI 1; Δ VOI 2; □ VOI 3) and time points were grouped together (d), there was a strong correlation between maximum velocity and hemoglobin saturation (ρ = 0.78, p= 0.0006, N = 15). There was also a strong correlation (e) between flow (vessel cross sectional area times ½ maximum velocity) and hemoglobin saturation (ρ = 0.89, p = 9 × 10⁻⁶, N = 15) and a moderate correlation (f) between shear rate on the vessel wall and hemoglobin saturation (ρ = 0.56, p = 0.03, N=15) when all VOI and time points were grouped together.

