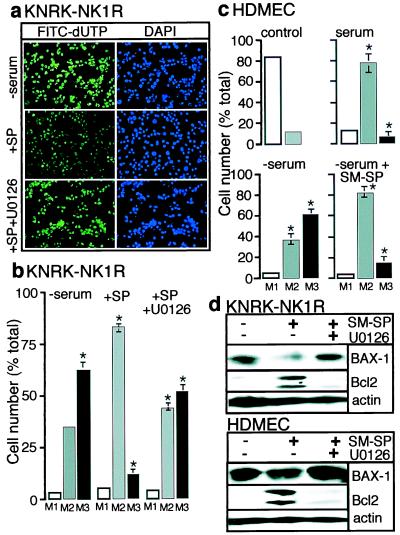
Figure 5.
Apoptosis assays. (a) KNRK-NK1R cells were serum-starved for 16 h, followed by continued serum starvation for 24 h in the absence (Top) or presence (Middle) of 10 nM SP, or in the presence of 10 nM SP and 20 μM U0126 (Bottom). TUNEL assay shows FITC-labeled Br-dUTP incorporation into apoptotic nuclei of cells (Left), and the 4′6-diamidino-2-phenylindole (DAPI) staining reveals nuclei (Right). (b) Fluorescence-activated cell sorter (FACS) analysis of data shown in a as a percentage of total cells (y axis) in each of three groups: M1 (no fluorescence), M2 (basal fluorescence, healthy cells), and M3 (high fluorescence, apoptotic cells). (c) HDMEC were serum-starved for 24 h in the absence or presence of 100 nM[Sar9MetO211]SP (SM-SP). FACS analysis was as in b. Control shows background fluorescence. (d) KNRK-NK1R cells or HDMEC were treated as described in a and c, and expression of proapoptotic BAX-1, antiapoptotic Bcl-2, and actin (control) was determined by Western blotting. *, P < 0.05, as compared with serum controls, n = 3 (b and d).

