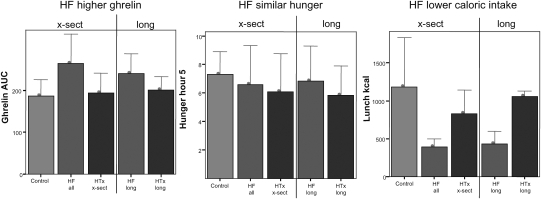
Figure 1.
Ghrelin area under the curve, hunger, and caloric intake in the longitudinal and cross-sectional cohorts. All subjects consumed a breakfast until absolute satiety to ensure that post-prandial assessments were not affected by differences in baseline food intake or satiety. For 5 h thereafter, the ghrelin area under the curve (AUC, ng min/mL) was significantly higher in HF than in control or HTx. Despite higher ghrelin, hunger was no different in HF compared with control or HTx. At the ad lib lunch meal, when subjects were neither encouraged nor dissuaded to eat, caloric intake was significantly and dramatically lower in HF than in control or HTx, despite significantly higher ghrelin. Hunger is measured on a 0–10 visual analogue scale. x-sect, cross-sectional; long, longitudinal.

