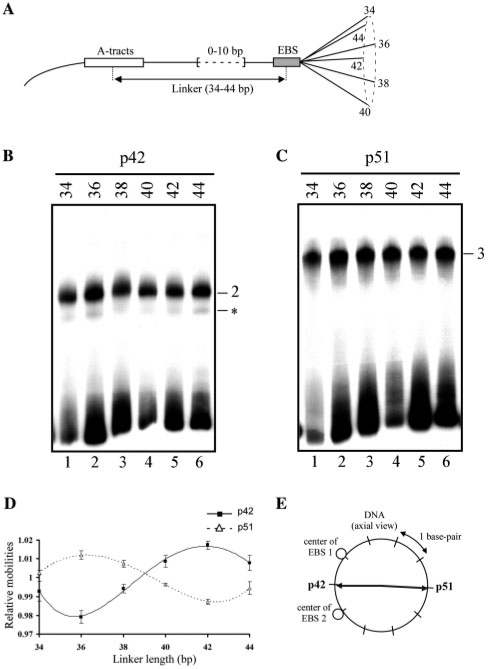
Figure 5.
Determination of DNA bend orientation induced by p51 and p42 Ets-1 isoforms. (A) Schematic representation of DNA probes used for phasing analysis. The probes contain A-tracts (open rectangle) and the Stromelysin-1 EBS palindrome (shaded rectangle). They are designated by linker length, i.e. the number of base pairs separating the A-tract and the EBS centers, which varied by 2 bp increments (0–10 bp), through one helical turn. (B, C) Gel shift assays performed with p42 (B) or p51 (C) in the presence of the probes described in A. Binary (2) and ternary (3) complexes are indicated. Non relevant complexes are indicated by an asterisk. (D) Relative mobility averaged from several independent EMSA experiments as a function of linker length and fitted to a sinusoidal function (lines). (E) DNA bend directions induced by p51 and p42 are represented by arrows in a plane perpendicular to the long DNA axis, positioned at the EBS palindrome center. EBS 1 and 2 are the centers of the two core motifs in the WT EBS palindrome.

