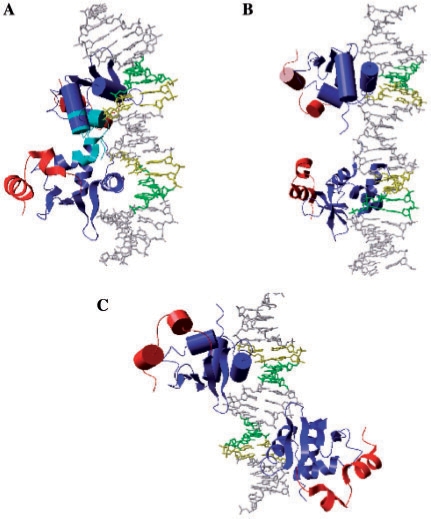
Figure 7.
Model of p51ΔN331–DNA–p51ΔN331 ternary complex. Models of ternary complex of p51ΔN331 proteins bound to WT (A), WT + 3 (B) or IP (C). The DBD monomers are in blue (one in ‘ribbon’, one in ‘cartoon’), and the C-terminal regions in red. The clash zones in A are in cyan. The EBS core motifs are in green for GG.CC and yellow for AA.TT bases.

