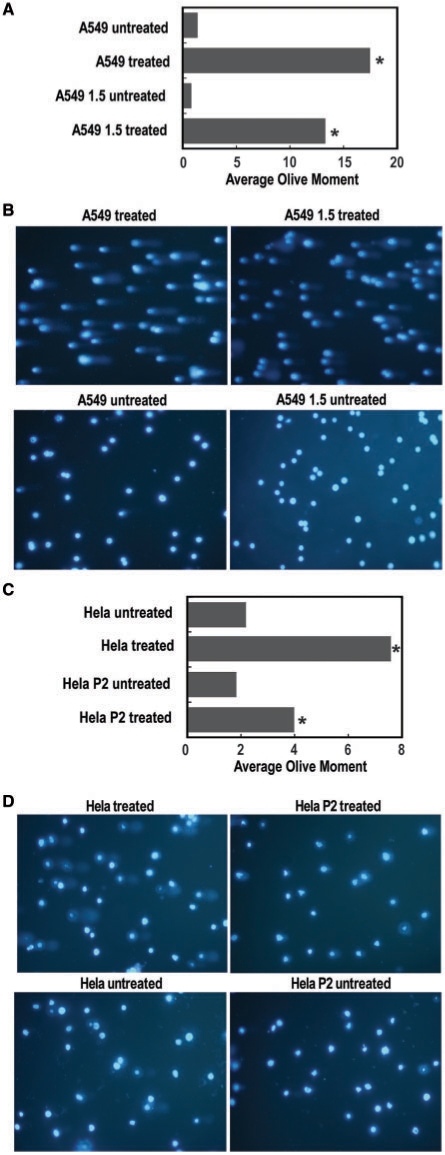
Figure 8.
Quantification of DNA damage via Comet assays. (A and C) The Olive tail moment from every cell present in a given sample image was determined until 100 cells were scored from each sample. The average tail moment values were then calculated for each sample and comparisons between the two treated and untreated samples analyzed with Student's t-test, which revealed significant differences only between treated samples (P < 0.05). (B and D) Representative images obtained with treated and untreated A549 and HeLa samples, respectively, as indicated.

