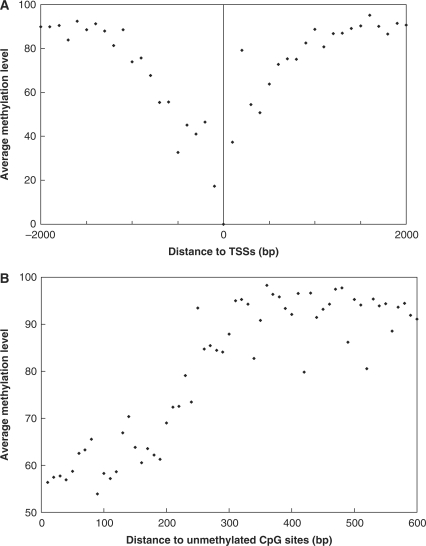
Figure 3.
The methylation profile of CpG sites sequenced. (A) CpG methylation near transcription start sites (TSSs). The X-axis represents the distance of CpG sites sequenced to the TSSs. The Y-axis represents the average methylation level. The average methylation levels were calculated for CpG sites adjacent to TSSs in 100-bp increments. (B) Spatial methylation correlation surrounding unmethylated CpG sites. The X-axis represents the distance to the nearest unmethylated CpG site. The Y-axis represents the average methylation level. The average methylation level of CpG dinucleotides were determined and plotted against the spatial distance, in 10-bp increments, to the nearest unmethylated CpG site.

