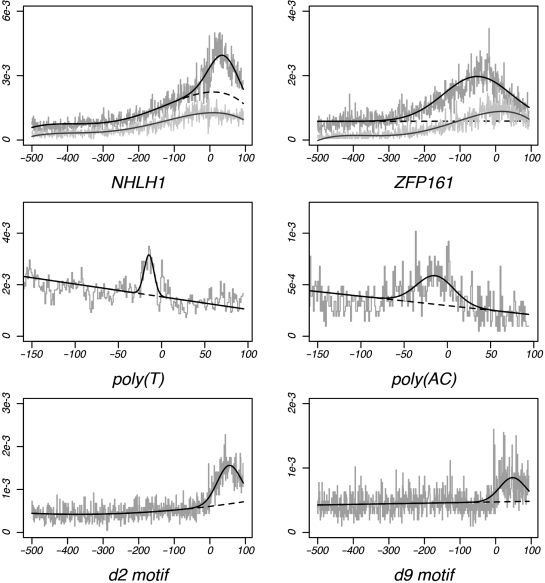
Figure 4.
MLFs of six motifs exhibiting positional enrichment. Top: MLFs for the GC-rich NHLH1-binding site and the ZFP161-binding site. Each plot shows results for both human (black) and simulated (gray) data sets. Dashed lines denote the background functions C(x). Middle: MLFs of the novel poly(T) 5-mer d3 and (AC)3 motif d10. Bottom: MLFs for the GCT-repeat motif d2 and its reverse complement d9. Each shows significant amounts of positional enrichment ∼50 bp after the TSS.

