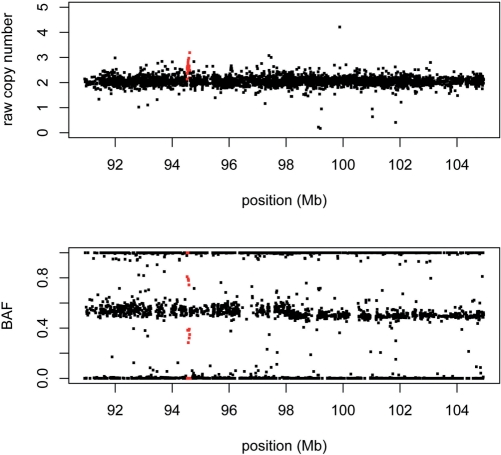
Figure 3.
Two sources of information from SNP arrays. The raw copy number (top panel) and BAF (bottom panel) are plotted for a 14 Mb region on chromosome 9. Both views of the data, from a custom Illumina array, provide evidence for a focal gain (in red). Note that the gain manifests itself in the BAF plot as clusters of points intermediary between 0.5 and 0 or 1, as expected from the values in Table 1.

