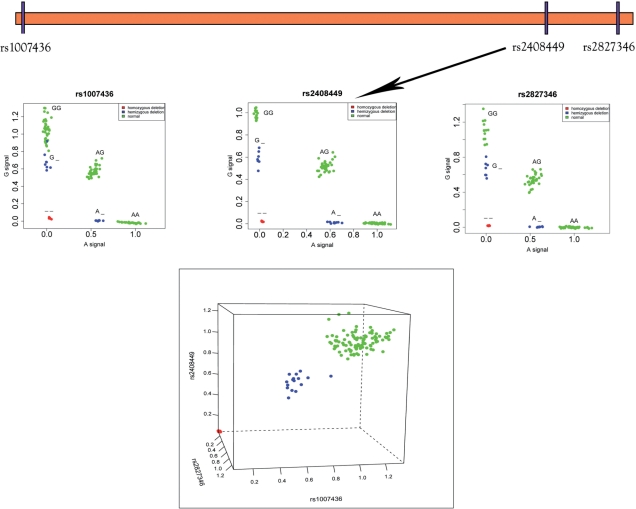
Figure 5.
Calling SNP/CNV alleles from raw data. All three SNPs shown here on chromosome 21 have alleles A and G. All plots show A allele and G allele intensity values from Illumina HumanHap550 data for 112 HapMap samples. The top three panels show each of the three SNPs individually along with their generalized genotypes. The bottom panel shows the total raw copy number sums (A signal + G signal) plotted, with each axis representing one of the SNPs. Note that the samples clearly separate into homozygous deletions (red), hemizygous deletions (blue), and normal (green).

