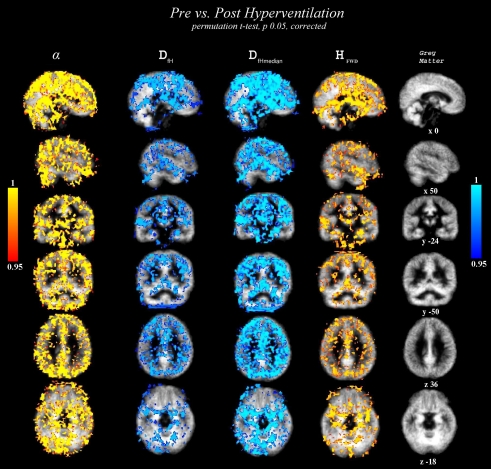
Figure 4.
Statistically significant variable changes (between the state of normal ventilation (Pre) and the hyperventilation modulated state (Post) (2-sample paired TFCE corrected permutation test, p < 0.05). The detected voxels are overlaid on the group level mean GM segment in the MNI coordinates in the same locations as in Figure 3. From left to right: α, DfH, DfHmedian and HFWD. Cold-blue colours = decrease, and warm red-yellow colours = increase in variable between Pre and Post, respectively.

