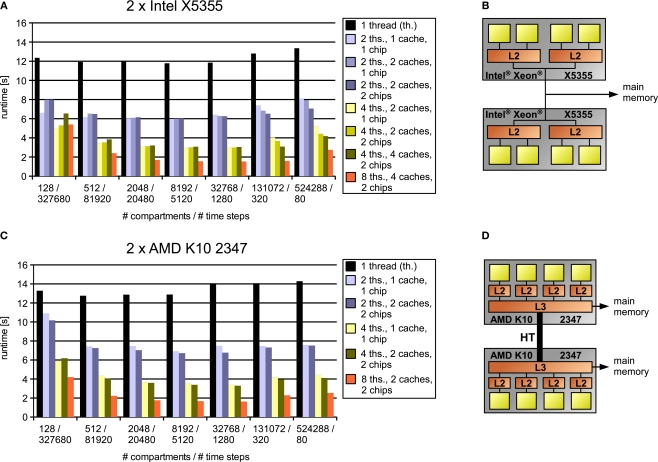
Figure 11.
Results for simulations (A,C) on two test systems (B,D) of artificially generated models where computational complexity is held constant by varying both model size and number of time steps simultaneously, thus emphasizing the influence of inter-core communication and memory bandwidth. Legend right to the diagrams indicates number of threads, cache organization (number of L2 caches for Intel processor/number of L3 caches for the AMD processor) and whether the cores used are located on one or two chips. The connection between two chips on the AMD system (D) is illustrated by a thick line modeling the HyperTransport interconnect (HyperTransport Consortium, 2007).

