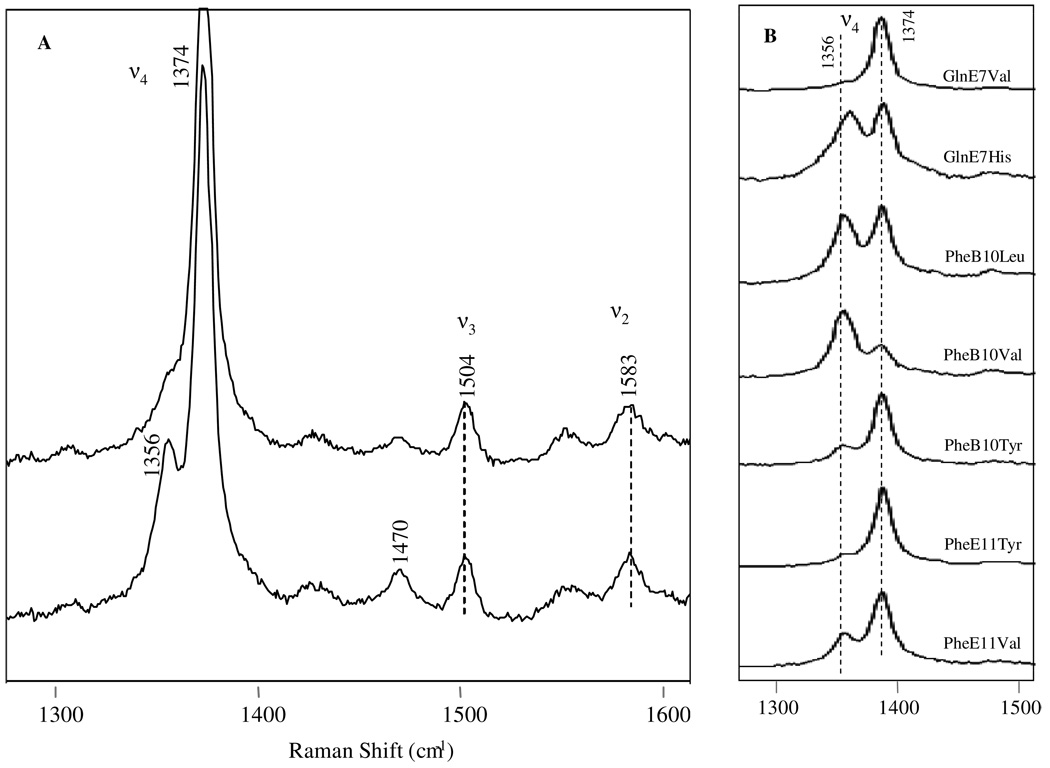
Figure 9.
High frequency resonance Raman spectra of the rHbI-H2S and mutant derivatives. The top trace in Figure 9A is the first spectrum recorded upon H2S reaction with the sample, while the second one is the last spectrum taken (after 30 minutes). The ν4, ν3, and ν2 modes are highlighted. Figure 9B shows the High frequency resonance Raman spectra of various HbI-H2S mutants, showing the contribution of ν4 band at 1356 cm−1, characteristic of deoxy species.

