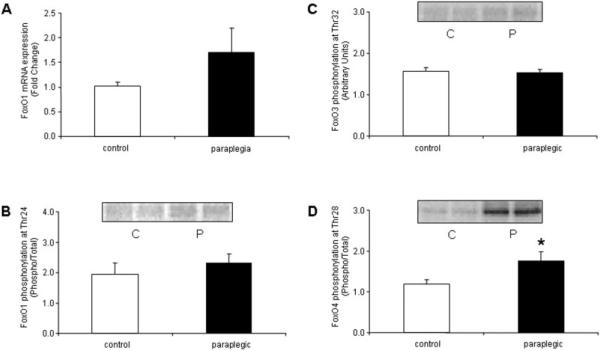
FIGURE 1.
Soleus muscle. (A) FoxO1 mRNA expression and phospho- (B) FoxO1, (C) FoxO3, and (D) FoxO4 protein expression from six control and six paraplegic rats. FoxO1 mRNA expression is labeled as fold change, FoxO1 and 4 protein are labeled as phospho/total, and FoxO3 protein is labeled in arbitrary units. All data are expressed as mean ± SE. (B-D) Representative blot images for respective phospho-FoxO protein. Protein images are loaded in duplicate for control (C) and paraplegic (P) rats. *Significantly different from controls (P < 0.05).

