
Figure 4.
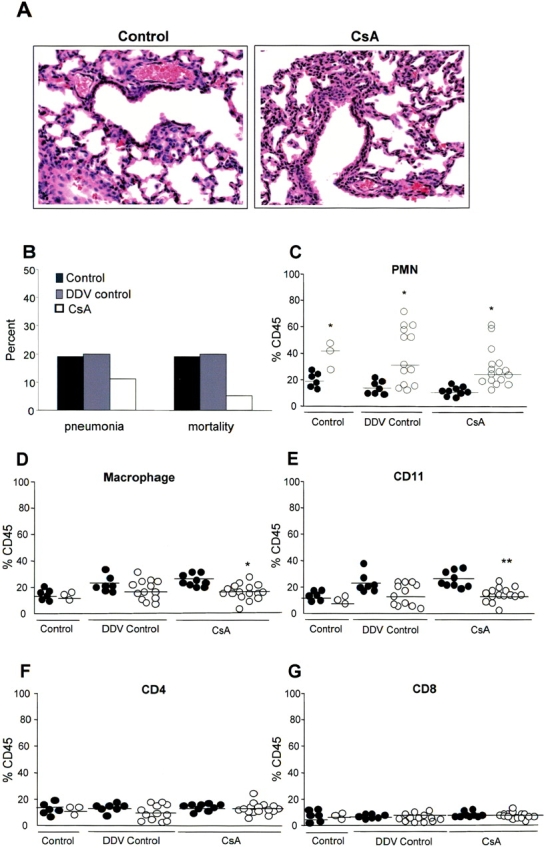
Effects of CsA in the host response to P. aeruginosa infection in vivo. (A) Hematoxylin and eosin staining of lung sections from representative uninfected mice in the control and cyclosporin-treated (CsA) group. (B) Percentage of P. aeruginosa PAO1-infected mice developing pneumonia (defined as the recovery of > 103 cfu per lung) and dying (mortality) in the control, ETOH-treated (DDV control), and cyclosporin-treated (CsA) groups. (C–G) Flow cytometry analysis of PMN, macrophage, CD11, CD4, and CD8 cell populations of lung homogenates expressed as a percentage of CD45+ cells. For each cell population, P. aeruginosa PA14-infected mice (PA14, filled circles) were compared with uninfected mice inoculated with PBS alone (PBS, open circles) in the control, the ETOH-treated (DDV control), and cyclosporin-treated (CsA) groups. *P < 0.05, **P < 0.001.