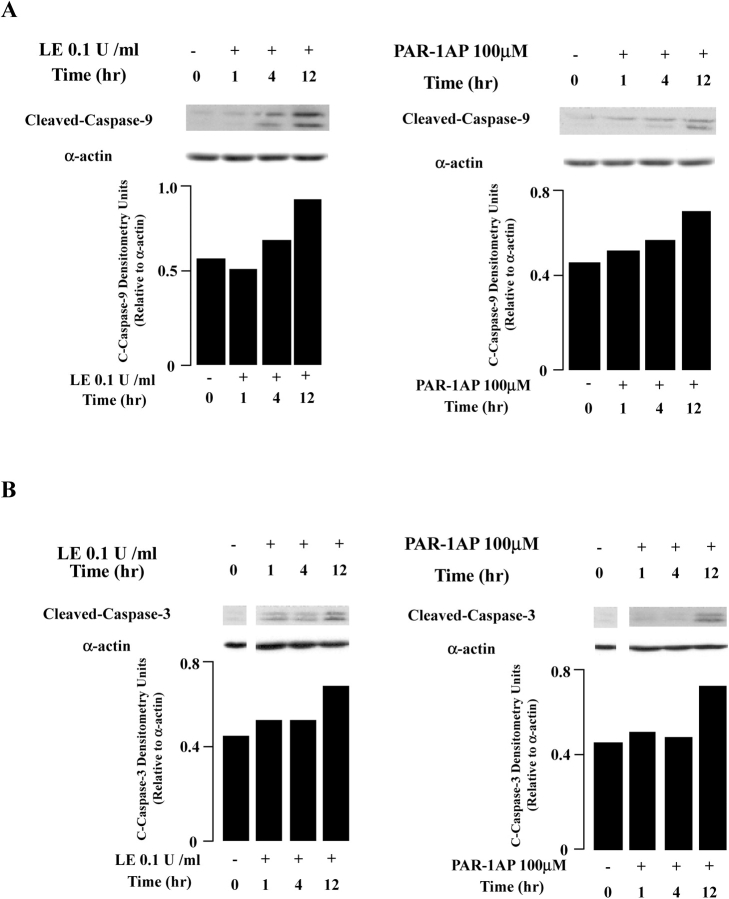
Figure 6.
Caspase activation by leukocyte elastase (LE) and PAR-1AP exposure in lung epithelial cells. A illustrates cleavage of caspase-9, and B illustrates cleavage of caspase-3 in BEAS2-B epithelial cells by Western blot analysis. The graph represents quantification by densitometry normalized for levels of α-actin. Representative data each from one of three experiments are shown.

