
Figure 3.
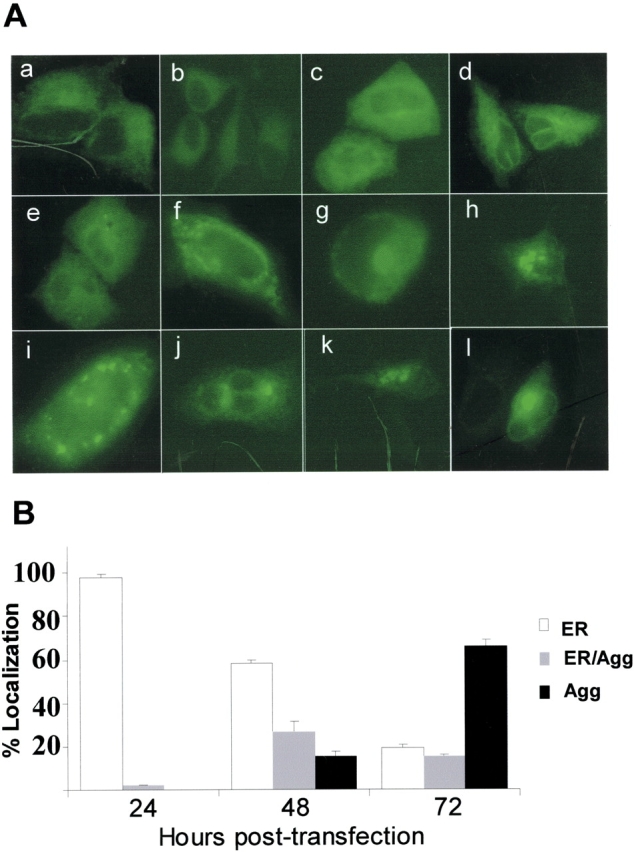
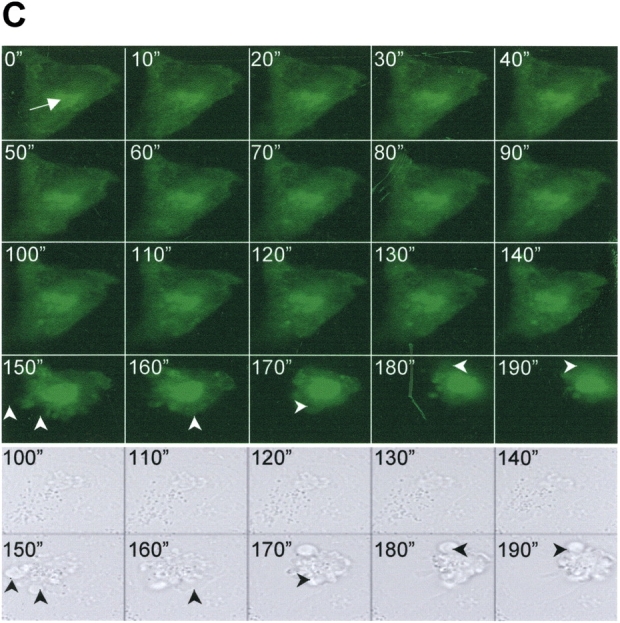
Time-dependent trafficking and cell injury associated with SP-CΔexon4 expression. (A) Representative live fluorescent images of A549 cells at different time intervals following introduction of EGFP/SP-CΔexon4. Times are post-transfection: (a, b) 12 h with 2 min exposure time; (c, d) 24 h with 100 ms exposure time; (e–h) 36–48 h with 100 ms exposure time; (i–l) 48–72 h with 100 ms exposure time. Heterogeneous expression patterns of mutant proteins included ER localization (a–e), aggregation (h, j, k, and l), or combined ER localization and aggregation (f, g, and i). (B) Subcellular localization of EGFP/SP-CΔexon4 at 24, 48, and 72 h after transfection in A549 cells. Data were obtained from three separate experiments, each with counts of at least 300 transfected cells. (C) A representative time-lapse fluorescent imaging series of cellular response to the expression of EGFP/SP-CΔexon4 showing time-dependent development of aggregates and subsequent cell death (10-min intervals). Imaging was initiated at 47 h after transfection (t = 0 min) with apparent ER localized expression and initial formation of juxtanuclear aggregates (arrow). Onset of cell recoiling at t = 140 min (49 h and 20 min after transfection). Within the next hour, complete recoiling with concurrent dish-surface detachment and cell blebbing (arrowheads) (bottom rows of both fluorescent and phase images). Cell death following transfection of EGFP/SP- CΔexon4 ranged from 48–72 h.