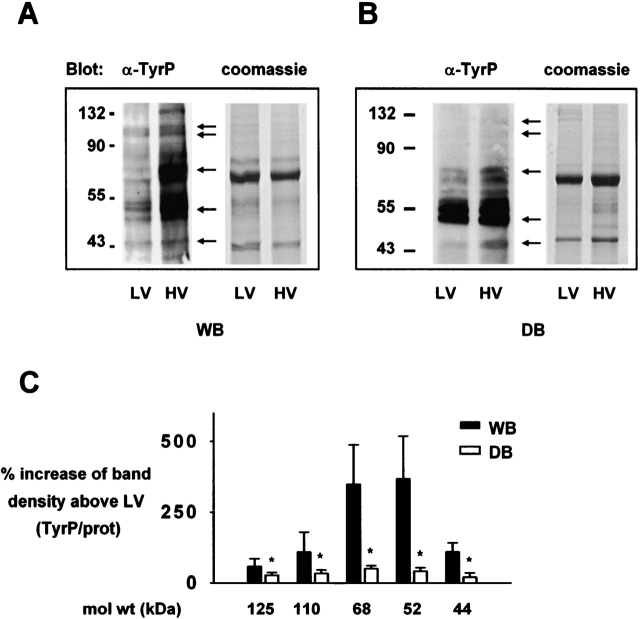
Figure 3.
Lung endothelial protein tyrosine phosphorylation. α-tyrP, anti-phosphotyrosine; HV, high tidal volume; LV, low tidal volume; WB, whole blood perfusion; DB, perfusion with leukocyte- and platelet- depleted blood. (A and B) anti-phosphotyrosine blots are of lysates of endothelial cells from lungs ventilated and perfused for 2 h as indicated. Arrows indicate prominent bands. Coomassie staining is on duplicate gels. Molecular weights are indicated on the left. (C) Bars represent HV-induced increases in band density (tyrosine phosphorylation/protein ratios). n = 3 for each bar. Mean ± SE, *P < 0.05 versus left bar by paired t test.

