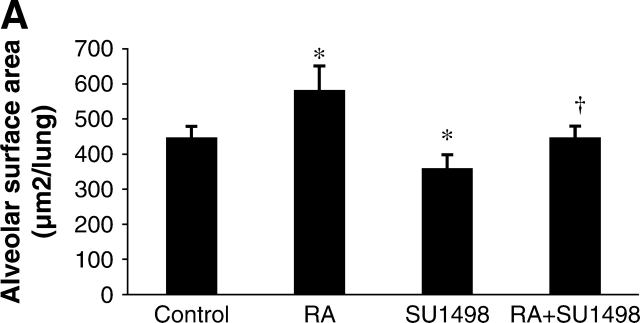
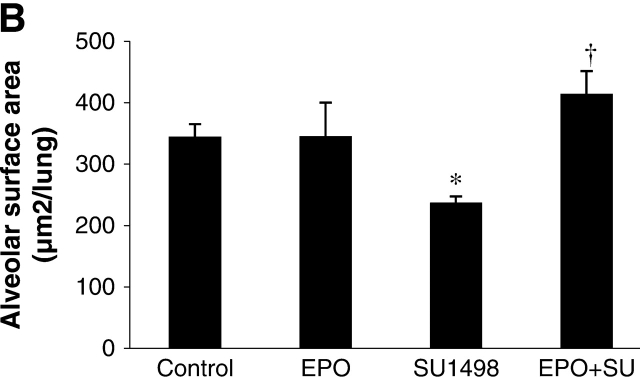
Figure 2.
Alveolar surface area in Day 21 mouse lung tissue. Graphical demonstration of alveolar surface area determinations after morphometric analysis of lungs from control, RA-treated, SU1498-treated, RA + SU1498–treated (A), or EPO-treated alone or in combined with SU1498 (B). Values represent mean ± SEM (n = 3–8). *P < 0.05 versus control, † P < 0.05 versus SU1498.


