
Figure 2.
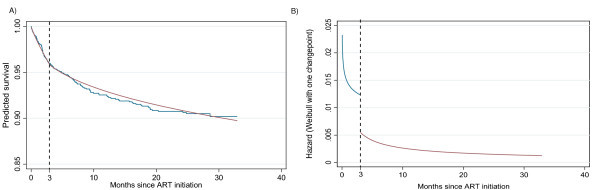
Survival estimates produced by Kaplan Meier versus a Weibull model with one changepoint (left panel) and hazard plot of the Weibull single-changepoint model (right panel). These are the estimates of the survival produced by the Weibull model with one changepoint (left panel). This panel is like the one on Figure 1 but with a "kink" in the Weibull curve. The hazard plot of the Weibull single-changepoint model is also given (right panel).