
Figure 3.
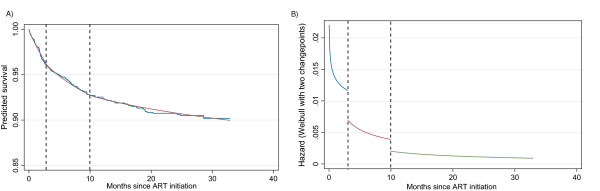
Survival estimates produced by Kaplan Meier versus a Weibull model with two changepoints (left panel) and hazard plot of the Weibull two-changepoint model (right panel). This figure is similar to the one presented in Figure 2 only the Weibull model with two changepoints (left panel) is now presented. The hazard plot of the Weibull two-changepoint model is also shown (right panel).