
Figure 5.
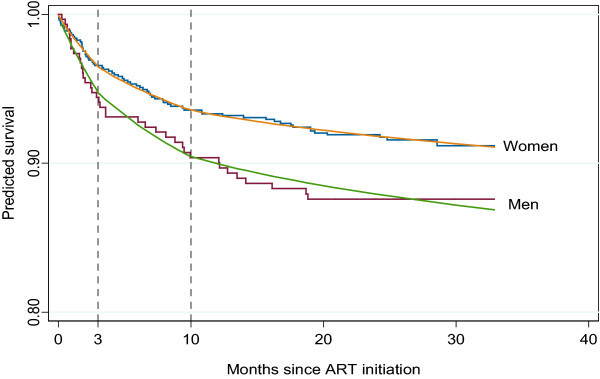
Survival estimates produced by Kaplan Meier versus a Weibull model with two changepoints for male and female patients. The figure is similar to the one presented in the left panel of Figure 3 but includes a stratification by gender to illustrate the methodology when subject subgroups are considered.