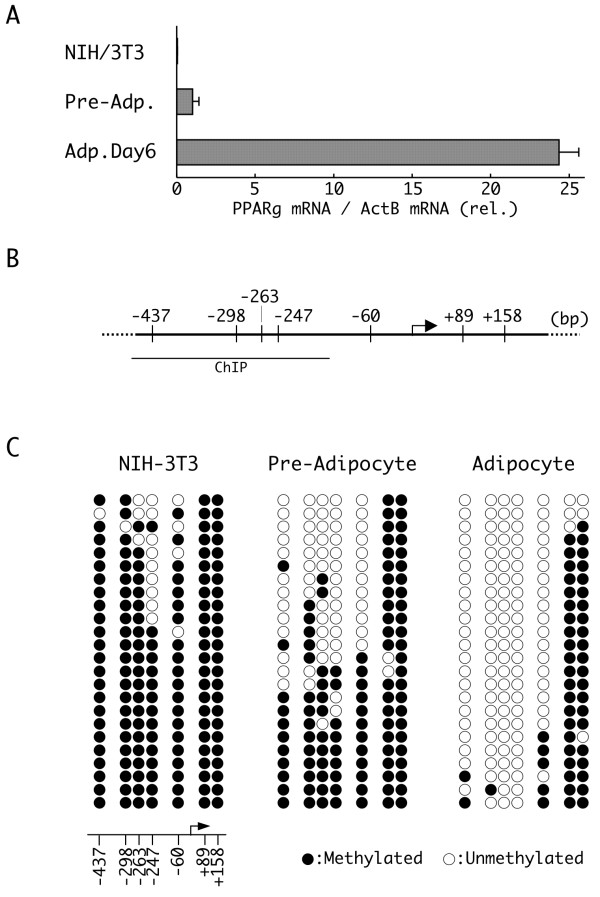
Figure 1.
Expression of peroxisome proliferators activated receptor γ (PPARγ) mRNA and differential methylation of the PPARγ promoter. (a) Relative expression of PPARγ mRNA in NIH/3T3, 3T3-L1 preadipocytes (day 0) and differentiated 3T3-L1 adipocytes (day 6). The expression of PPARγ and β-actin mRNAs were determined by real time reverse transcriptase polymerase chain reaction (RT-PCR). The level of PPARγ mRNA was normalized to that of β-actin, and the relative normalized levels are shown (n = 3, mean ± SD). (b) A schematic diagram of the PPARγ promoter. An arrow indicates the transcription start site (TSS) (+1 bp), and short vertical lines indicate the positions of the methylation sites relative to the TSS. The region detected by the chromatin immunoprecipitation (ChIP) analysis is indicated below the schematic (see Figure 4). (c) Bisulfite sequencing analysis of the DNA methylation profile of the individual CpG sites in the PPARγ promoter in NIH/3T3, 3T3-L1 preadipocytes (day 0) and 3T3-L1 adipocytes (day 6). Each PCR product was subcloned, and eight clones were subjected to sequencing analysis. The data represent the aggregate total of three independent experiments. The methylation status of each site, either methylated (closed circle) or unmethylated (open circle), is aligned corresponding to their genomic order (represented at the bottom of the results for NIH/3T3 cells).

