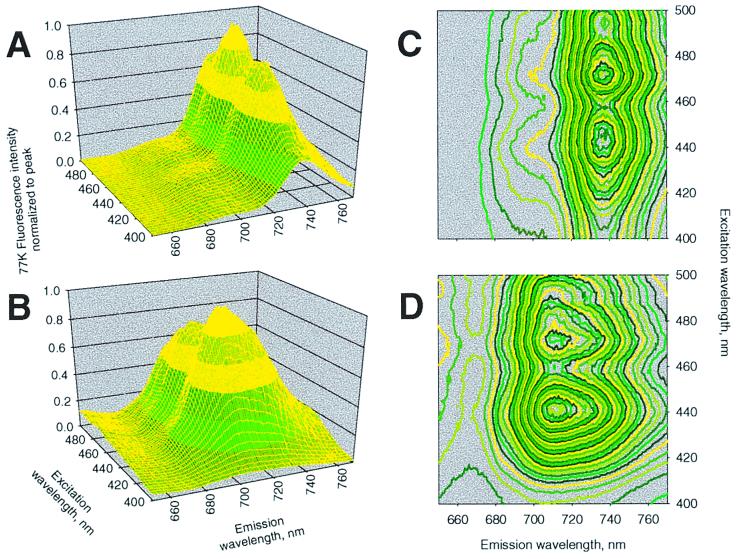
Figure 1.
Liquid nitrogen temperature (77 K) Chl fluorescence excitation vs. emission spectral contour plots of E. pauciflora leaves representing deacclimated (A and C) and winter high-light acclimated states (B and D). The concentrations (μmol m−2) of Chls a and b, respectively, were 410 and 98 in leaf A and 164 and 34 in leaf B. The spectral contours were normalized to the peak emission amplitude.

