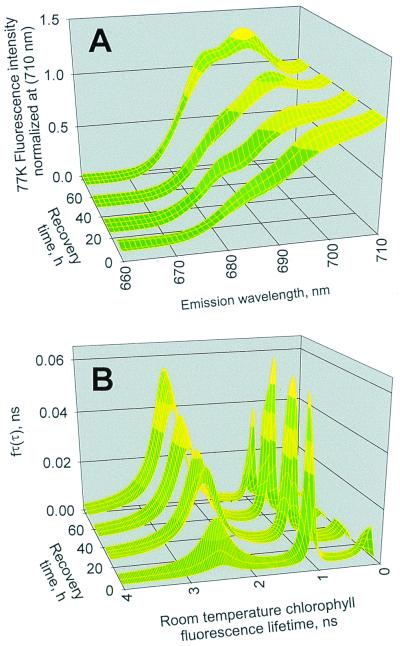
Figure 2.
Kinetics of changes in the 77 K Chl a fluorescence emission spectra and room temperature fluorescence lifetimes during winter deacclimation of E. pauciflora leaves. (A) Time-dependent changes in 77 K Chl fluorescence spectral profiles of the PSII-associated spectral region during recovery from winter acclimation. The emission profiles represent the integrated excitation from 400 to 500 nm. (B) Corresponding time-dependent changes in the room temperature Chl fluorescence lifetime distributions measured in parallel with the 77 K spectral profiles in A. Data on the recovery time axes in A and B are plotted as the moving average for each day of measurements for four leaves (two leaves per plant).

