Fig. 5.


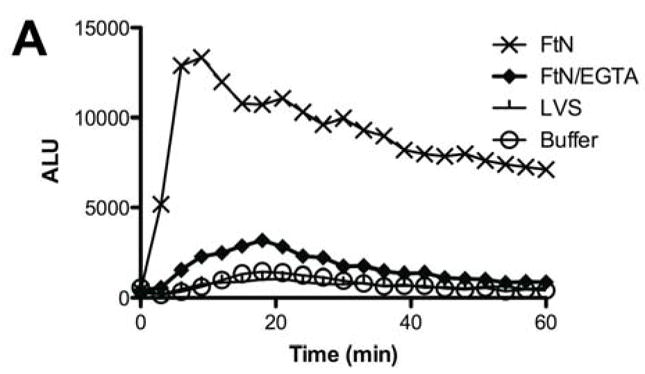
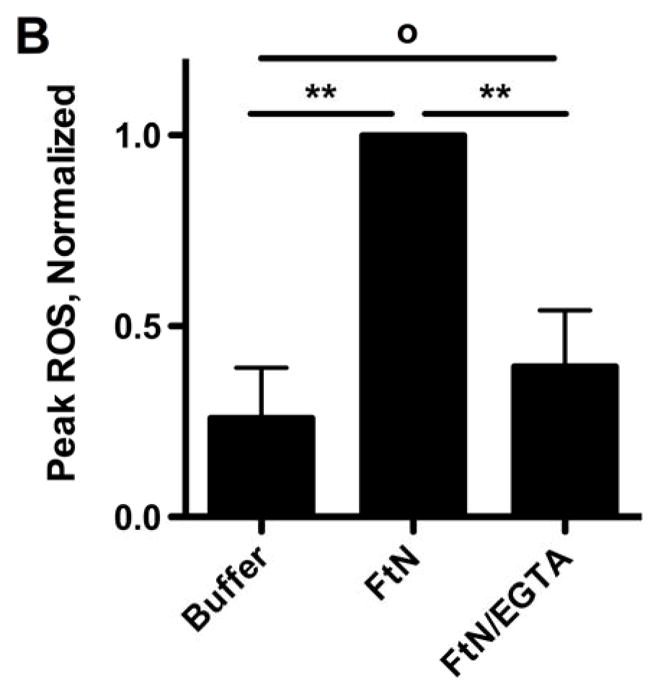
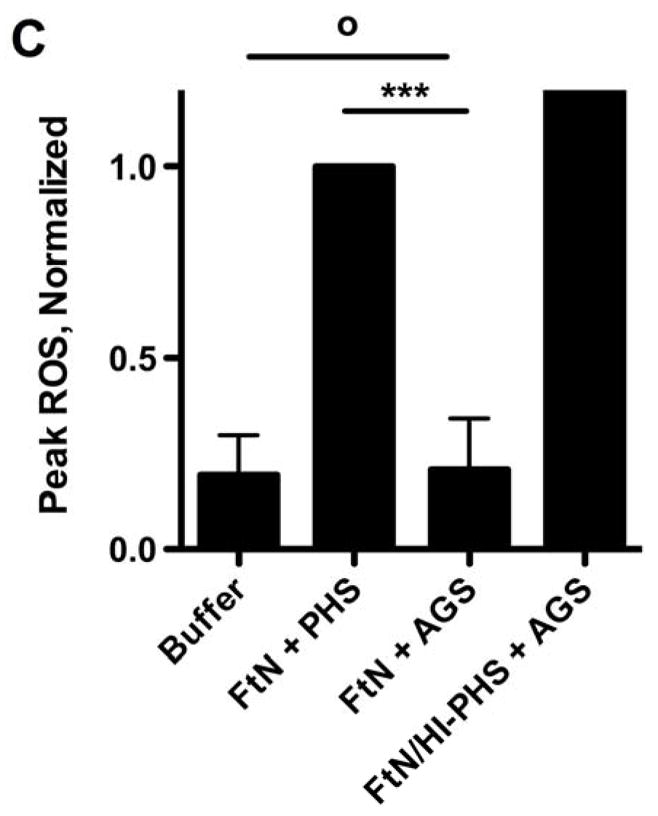
The PMN LCL response to FtN required antibody-mediated C3 deposition. (A) Opsonized bacteria were incubated with human PMN at an MOI of 50:1 for 60 min. LCL was measured as in Fig. 1A. This result is representative of three independent experiments. (B) Peak ROS was determined for each sample in the three experiments represented by Fig. 5A and normalized to the peak FtN. Results are expressed as the mean ± SD. (C) FtN were opsonized in AGS or PHS as described in Fig. 3B prior to incubation with PMN, and peak LCL was determined. Uninfected PMN were incubated in identical buffer without bacteria. N = 3. Results are expressed as the mean ± SD. °, P > 0.05; **, P < 0.01; ***, P < 0.001.
